
iStability MKT - Examples
These examples will show you how iStability MKT will help you visualize and understand your data and, most importantly, calculate your Mean Kinetic Temperature.
Your Data
Your data can be as simple as a series of temperatures from 1 temperature probe or as complex as a series of temperatures from multiple probes. The following example consists of temperature readings from 5 different probes at 4 different time periods, as shown in the screenshot below:
Your data can be as simple as a series of temperatures from 1 temperature probe or as complex as a series of temperatures from multiple probes. The following example consists of temperature readings from 5 different probes at 4 different time periods, as shown in the screenshot below:
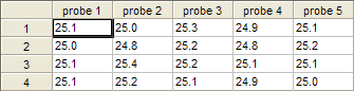
Each row is a different time period. Your temperature monitoring system can probably generate this CSV file for you, but if not, you can easily create this in Microsoft Excel (or any other spreadsheet program) and save as a Comma-Separated-Values (CSV) file. The raw dataset looks like this:
iStability MKT Results
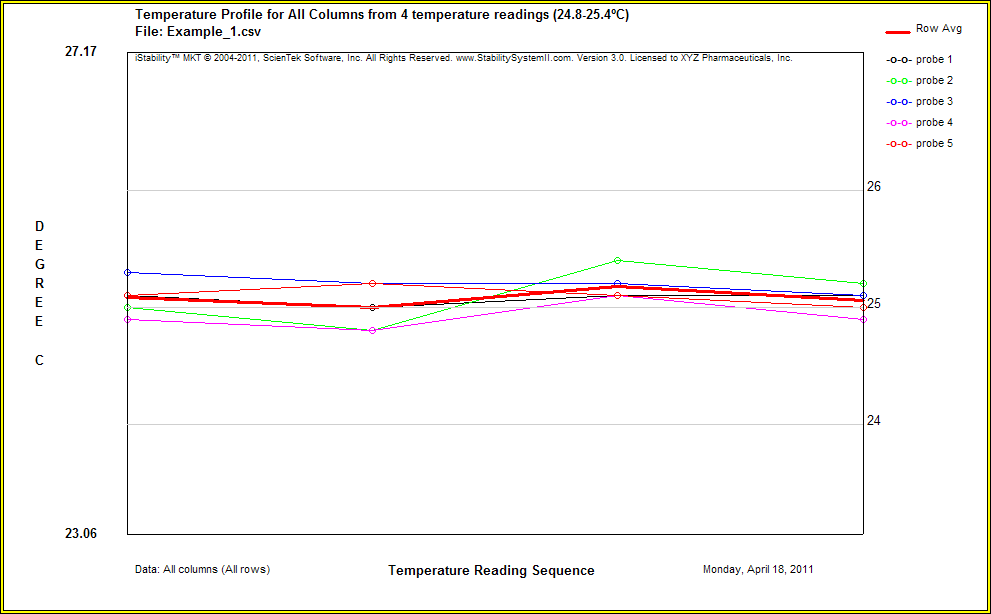
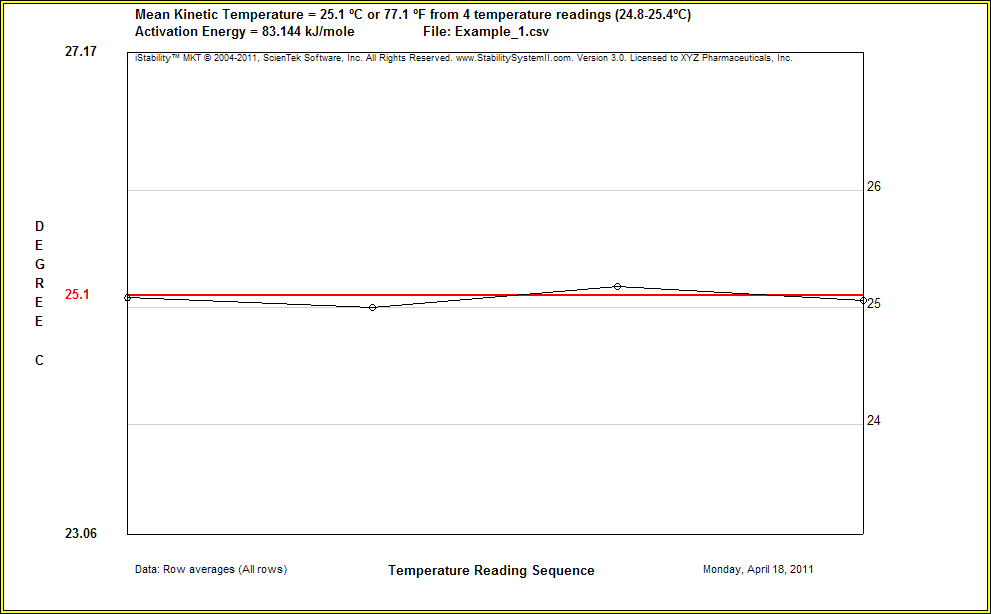
iStability MKT can generate many types of graphs:
(a) Data from all temperature probes (See screenshot on the left below)
(b) Row averages of all temperature probes (See the screenshot on the right below)
(c) Every 2nd row, every 3rd row, etc. - This is so you can visualize the effect of reduced datasets on the computed MKT. This potentially will help determine the frequency required for temperature data collection.
Other Information
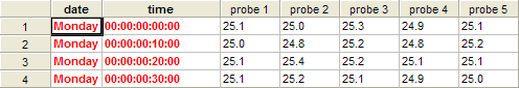
Your CSV files may be automatically generated by your temperature monitoring system. It is very likely that the CSV files are generated with row identifier columns, such as the date and time. iStability MKT allows for the CSV files to have up to 2 row identifiers, as shown in the screenshot below:
Your CSV files may be automatically generated by your temperature monitoring system. It is very likely that the CSV files are generated with row identifier columns, such as the date and time. iStability MKT allows for the CSV files to have up to 2 row identifiers, as shown in the screenshot below:
A Short History of MKT by ScienTek Software, Inc.
ScienTek Software has a white paper about the history leading to the MKT concept. Click here to view the white paper.
ScienTek Software has a white paper about the history leading to the MKT concept. Click here to view the white paper.